Using Website Event Tagging Data to A/B Test Ads
Hypothesis: There is a difference in purchases as a result of the new ad.
Check the table
We are running an experiment at an item-level, which means all users who visit will see the same page, but the layout of different item pages may differ. Compare this table to the assignment events we captured for user_level_testing. Does this table have everything you need to compute metrics like 30-day view-binary?
SELECT
  *
FROM
  dsv1069.final_assignments_qa

Reformat the table
Reformat the final_assignments_qa to look like the final_assignments table, filling in any missing values with a placeholder of the appropriate data type.
SELECT
  item_id,
  test_a       AS test_assignment,
  'test_a'     AS test_number,
  '2020-01-01' AS test_start_date
FROM
  dsv1069.final_assignments_qa

Order Binary Metric
Create order binary for test.
SELECT
  test_assignment,
  COUNT(item_id) as items,
  SUM(order_binary_30d) AS items_ordered_30d
FROM
(
  SELECT
   f.test_assignment,
   f.item_id,
   MAX(CASE WHEN orders.created_at > f.test_start_date THEN 1 ELSE 0 END)  AS order_binary_30d
  FROM
    dsv1069.final_assignments f

  LEFT OUTER JOIN
    dsv1069.orders
  ON
    f.item_id = orders.item_id
  AND
    orders.created_at >= f.test_start_date
  AND
    DATE_PART('day', orders.created_at - f.test_start_date ) <= 30
  WHERE
    f.test_number= 'item_test_2'
  GROUP BY
    f.test_assignment,
    f.item_id
) item_orders
GROUP BY test_assignment

View Item Metric
Compute view item metrics.
SELECT
test_assignment,
COUNT(item_id) AS items,
SUM(view_binary_30d) AS viewed_items,
CAST(100*SUM(view_binary_30d)/COUNT(item_id) AS FLOAT) AS viewed_percent,
SUM(views) AS views,
SUM(views)/COUNT(item_id) AS average_views_per_item
FROM
(
 SELECT
   f.test_assignment,
   f.item_id,
   MAX(CASE WHEN item_views.event_time > f.test_start_date THEN 1 ELSE 0 END)  AS view_binary_30d,
   COUNT(item_views.event_id) AS views
  FROM
    dsv1069.final_assignments f
  LEFT OUTER JOIN
    (
    SELECT
      event_time,
      event_id,
      CAST(parameter_value AS INT) AS item_id
    FROM
      dsv1069.events
    WHERE
      event_name = 'view_item'
    AND
      parameter_name = 'item_id'
    ) item_views
  ON
    f.item_id = item_views.item_id
  AND
    item_views.event_time >= f.test_start_date
  AND
    DATE_PART('day', item_views.event_time - f.test_start_date ) <= 30
  WHERE
    f.test_number= 'item_test_2'
  GROUP BY
    f.test_assignment,
    f.item_id
) item_orders
GROUP BY
 test_assignment

Results

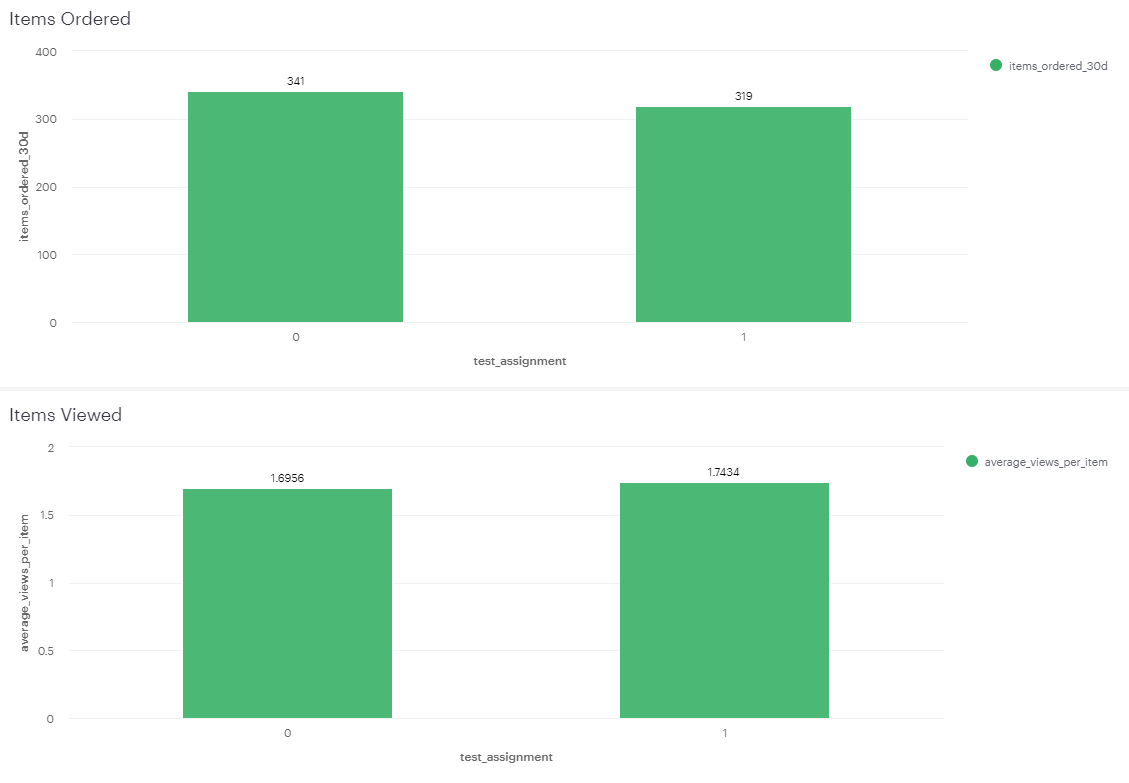
Using the A/B testing required from this link: https://thumbtack.github.io/abba/demo/abba.html, I was able to calculate the p-value for a 95% confidence interval. There was an improvement of 2.6% in the conversion rate of products with the new ad. However, with a p value of .2 the results are not statistically significant. Therefore, we cannot conclude that the variation in conversion rate was caused by the new ad.